Most Telegram channel owners post content hoping for likes, shares, and new subscribers. But without knowing what actually works, you’re just guessing. What if you could look at your data and see exactly which videos, GIFs, or images your audience responds to? That’s not magic-it’s analytics. And it’s the difference between a channel that fades away and one that grows steadily, even without a big budget.
What You’re Missing with Native Telegram Analytics
Telegram’s built-in stats give you two things: total subscribers and total views. That’s it. You can’t tell if a video got more views than a photo. You can’t see if a message with a 10-word caption performed better than one with 50 words. You can’t even tell if people are sharing your posts or just scrolling past them.That’s like driving a car with only a speedometer and no fuel gauge. You know how fast you’re going, but you have no idea if you’re running on empty. Most people never realize this until they spend months posting content that gets zero engagement-and wonder why.
Real optimization starts when you move beyond Telegram’s basic numbers. You need tools that break down performance by content type, time of day, text length, and even audience behavior. That’s where third-party analytics platforms like TGStat, Popsters, and CRMChat come in.
Key Metrics That Actually Matter
Not all numbers are created equal. Here are the only metrics you need to track to optimize your multimedia mix:
- View Rate (VR): How many people actually saw your post compared to your total reach. A video might have 10,000 views, but if your channel has 50,000 subscribers, that’s only a 20% view rate. That’s low. A well-timed image might hit 80%.
- Engagement Rate: The percentage of viewers who reacted, replied, or forwarded. A post with 1,000 views and 150 reactions has a 15% engagement rate-that’s strong.
- Forward Rate: How often people share your content. This is the gold standard. If 1 in 5 people forward your post, you’ve created something worth spreading.
- Click-Through Rate (CTR): If you’re using links, how many people clicked them? This tells you if your call-to-action works.
- Text Length Correlation: Does your audience prefer short, punchy messages or detailed explanations? Analytics tools show you the sweet spot. For example, one financial channel found posts under 15 words got 3x more forwards than longer ones.
These aren’t vanity metrics. They tell you what to post, when to post it, and who cares.
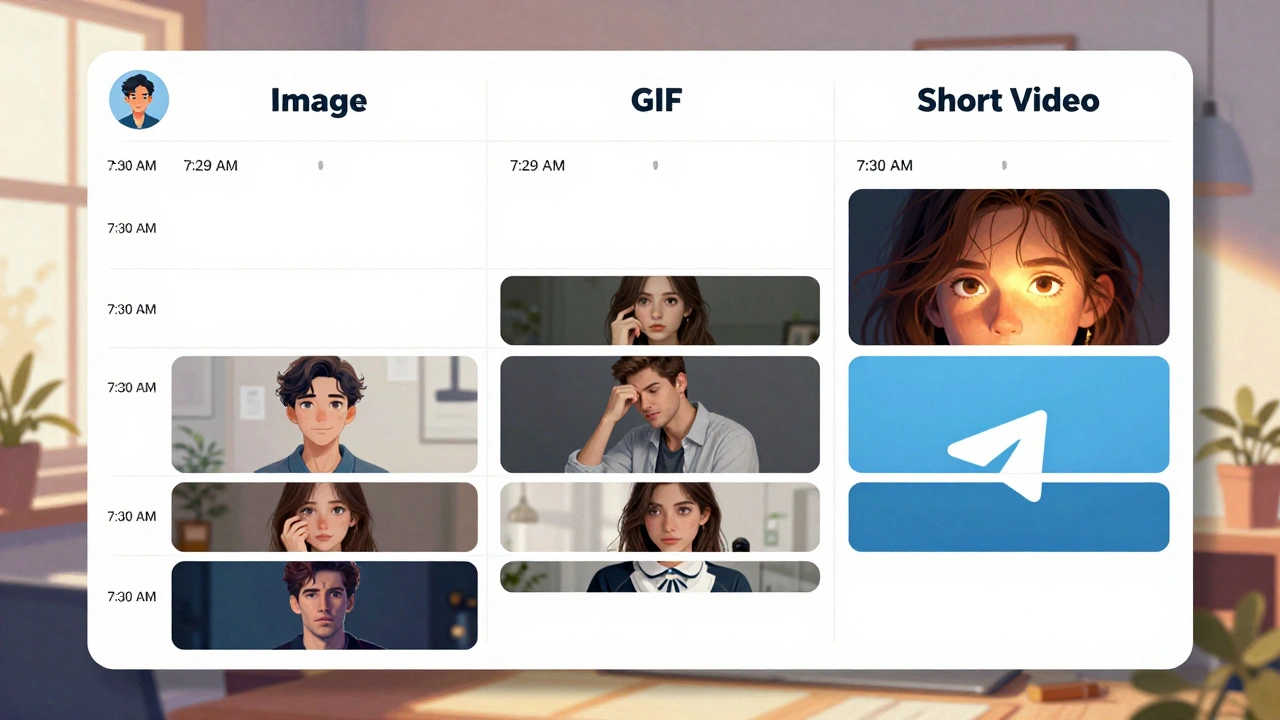
How Different Media Types Perform
Not all visuals are equal. Here’s what the data shows:
| Content Type | Average View Rate | Average Engagement Rate | Average Forward Rate | Best Use Case |
|---|---|---|---|---|
| Static Images | 72% | 14% | 8% | Quick updates, infographics, announcements |
| GIFs | 68% | 18% | 12% | Humor, reactions, emotional hooks |
| Short Videos (under 15s) | 59% | 21% | 15% | Product demos, tips, behind-the-scenes |
| Long Videos (over 1min) | 28% | 5% | 2% | Deep dives, interviews, tutorials (only for niche audiences) |
| Text-Only Posts | 61% | 11% | 6% | News, summaries, questions to spark replies |
Notice something? GIFs and short videos outperform everything else in engagement and sharing. But static images still win in view rate-they’re quick to load, easy to consume, and don’t require sound. That’s why the best channels use them together: an image to grab attention, a GIF to add emotion, and a short video to explain something complex.
Timing Isn’t Guesswork-It’s Data
Posting at 9 PM because "everyone’s online then"? That’s outdated. Your audience isn’t like everyone else.
One educational channel analyzed their data and found their top-performing posts went live between 7:30 AM and 8:15 AM on weekdays. Why? Their users were students who checked Telegram right after waking up. Another channel for freelancers saw spikes at 11 PM-when people were winding down and scrolling.
Analytics tools like Popsters and TGStat let you see engagement patterns by hour and day. You don’t need to guess. Just look at the graph. If your peak is Tuesday at 4 PM, schedule your most important content then. Repeat. That’s how consistency is built.
Segmentation: One Size Doesn’t Fit All
Not all your subscribers are the same. Some are casual followers. Others are loyal members who reply to every post. Some joined for videos. Others came for text updates.
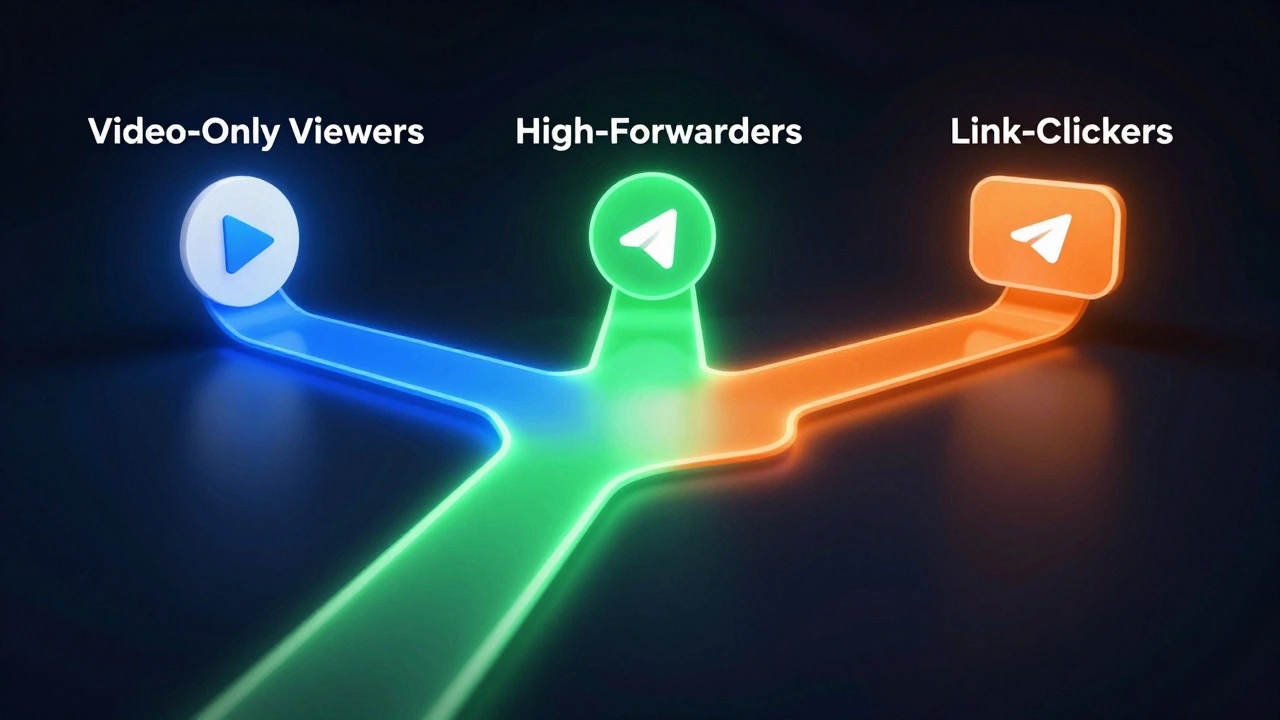
Advanced analytics lets you segment audiences by behavior:
- People who only open video posts
- Users who forward content more than 3 times a week
- Subscribers who click links but never react
One financial news channel discovered that premium subscribers engaged 4x more with detailed market charts than with headlines. So they started sending exclusive chart packs to that group-no spam, no fluff. Retention jumped 37% in two months.
Another channel noticed paying users downloaded files faster than free users. They started offering downloadable PDFs as a premium perk. Downloads increased 60%, and churn dropped.
Segmentation turns generic content into personalized value. And personalized value keeps people around.
How to Set Up Your Optimization System
You don’t need to be a data scientist. Here’s how to start:
- Install one analytics tool-TGStat (free) or Popsters (paid). Both give you content-type breakdowns.
- Track for 30 days. Post a mix: images, GIFs, short videos, text. Don’t change anything else.
- Find your top 3 performers. Which format got the highest forward rate? Which time had the most replies?
- Create a content calendar based on that data. If GIFs outperform images, make 3 GIFs per week. If 7 AM is your peak, schedule everything then.
- Test one variable at a time. Next week, try shorter captions. See if engagement goes up. Then test a different call-to-action. Don’t change everything at once.
- Automate reminders. Use a bot to send you a daily digest: "Yesterday’s top post: GIF with 22% engagement. Your best time: 7:30 AM."
That’s it. No fancy tools. No complex dashboards. Just data, repeat, improve.
Common Mistakes (And How to Avoid Them)
- Mistake: Posting the same thing every day. Solution: Rotate formats. If you post text on Monday, do a video on Tuesday. Keep it fresh.
- Mistake: Ignoring replies. Solution: If people reply to a certain topic, make it a recurring theme. Engagement breeds more engagement.
- Mistake: Chasing viral content. Solution: Viral posts are luck. Consistent data-backed posts are strategy.
- Mistake: Using long videos for everything. Solution: Most Telegram users scroll fast. Keep videos under 15 seconds unless you’re targeting a niche.
What Success Looks Like
After 60 days of data-driven optimization, channels that follow this method see:
- 30-60% increase in forward rate
- 20-40% higher engagement rate
- 15-30% growth in subscriber retention
- 2-3x more clicks on links
One channel went from 8,000 to 15,000 subscribers in 4 months-not because they bought ads, but because they stopped guessing and started measuring.
You don’t need more content. You need smarter content. And that only comes from data.
Do I need to pay for analytics tools to optimize my Telegram channel?
No. TGStat’s free plan gives you enough data to start-view rates, top posts, and engagement trends. You only need paid tools if you’re managing multiple channels or want advanced features like image recognition or audience segmentation. For most users, free tools are enough to make huge improvements.
How often should I post to get the best results?
It depends on your audience’s behavior. Some channels thrive with 1-2 posts per day. Others do better with 3-4 per week. Use analytics to find your peak engagement times. If your audience is most active on weekdays at 8 AM, post once then. Don’t flood them. Quality over quantity always wins on Telegram.
Can I use analytics to grow my Telegram group, not just my channel?
Yes. Tools like Combot and TGStat track group activity, including message replies, user participation, and peak hours. You can see which topics spark the most discussion and double down on them. Group growth comes from engagement, not just membership numbers.
What’s the biggest mistake people make when using Telegram analytics?
They look at total views and assume that’s success. A post with 10,000 views but 50 reactions is low-performing. What matters is how many people interacted, shared, or clicked. Focus on engagement and forward rates-not vanity numbers.
Should I copy what other successful channels are posting?
Don’t copy. Compare. Use tools like TGStat to see what top channels are posting, but then test it on your own audience. What works for a tech channel might flop for a cooking group. Your data is your compass-not theirs.
If you’re serious about growing on Telegram, stop guessing. Start measuring. Your audience will thank you-with their clicks, shares, and loyalty.