Most Telegram channel owners think more subscribers = more success. They celebrate hitting 10K, then wonder why their ads aren’t making money. The truth? Cohort analysis for Telegram subscribers by acquisition source is the only way to know which of those 10K people actually matter.
Imagine you spend $5,000 on Facebook ads and gain 1,200 new subscribers. Looks great, right? But if 900 of them vanish within two weeks, you’re not growing - you’re spinning wheels. Cohort analysis cuts through the noise. It doesn’t just count who joined. It tracks where they came from and what they did after. This isn’t theory. It’s what top-performing Telegram channels use to triple their revenue.
Why Telegram’s Native Analytics Won’t Cut It
Telegram’s built-in stats show total subscribers, message views, and maybe a graph of growth over time. That’s it. No breakdown by source. No retention curves. No way to tell if your TikTok ad drove 500 users who never opened a single message - or if your referral program brought in 200 people who read every post for six months.
That’s like buying a car with only a speedometer. You know how fast you’re going, but you have no idea if you’re driving in circles. According to Telegram’s own developer update from December 2023, their native tools are “insufficient for sophisticated acquisition analysis.” And they admitted they’re working on better features - but didn’t say when.
Meanwhile, channels using third-party tools are already seeing results. A case study from Popsters in December 2023 showed that channels using cohort analysis identified 37% more actionable insights than those relying on Telegram’s dashboard alone. If you’re not tracking by source, you’re guessing.
What Cohort Analysis Actually Tracks
Cohort analysis groups subscribers by when and how they joined. A cohort could be “everyone who subscribed via Google Ads between January 1-7, 2026.” Then you track what they did next.
Here are the five key metrics you need to measure:
- Subscription source - Did they come from a Facebook ad? A YouTube video? A friend’s invite link? This is the foundation.
- Retention at 7, 30, and 90 days - How many stayed active? A 7-day retention of 60% is solid. Below 40%? You’ve got a leak.
- Engagement rate - Clicks per 1,000 impressions. If your cohort reads every message, they’re valuable. If they never tap a link, they’re dead weight.
- Conversion rate - Did they buy your product? Sign up for your course? Join your paid group? This turns followers into revenue.
- Lifetime value (LTV) - How much money does each subscriber from this source bring over time? A $200 LTV from organic referrals beats a $50 LTV from paid ads any day.
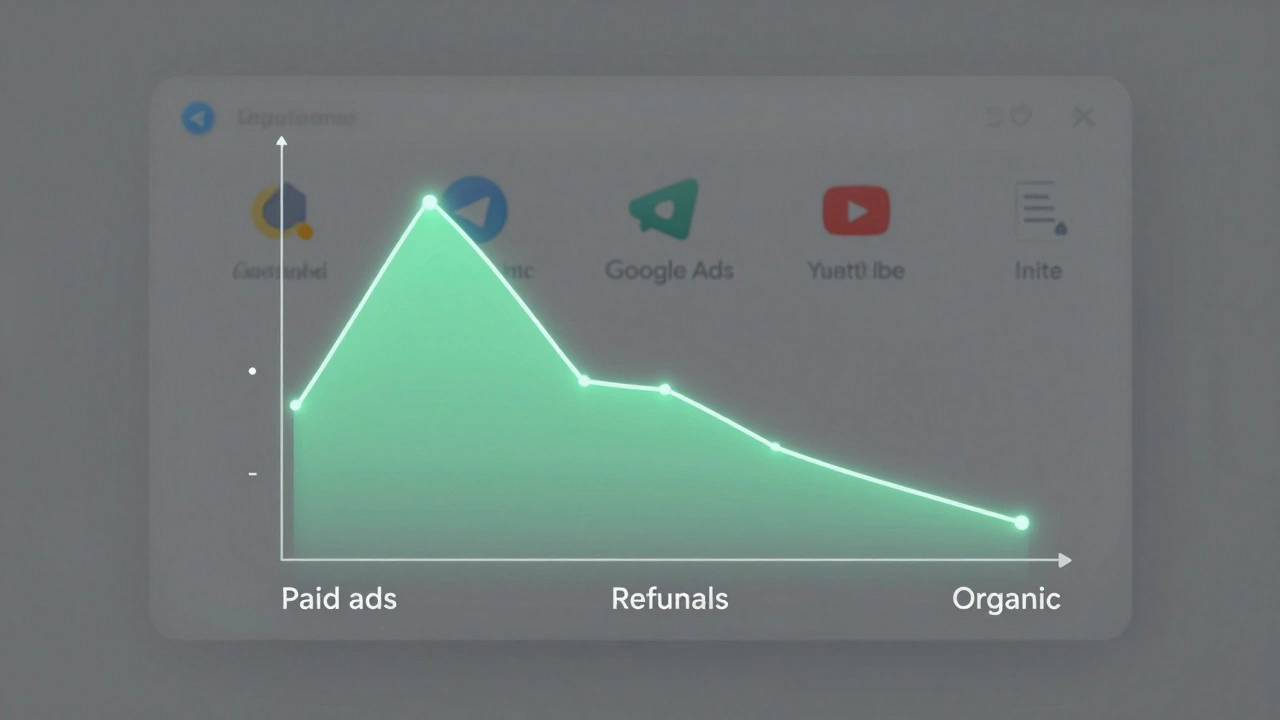
Tools like MVP Project and Telechurn.com visualize this as color-coded curves. You’ll see retention drop sharply for paid traffic - and hold steady for organic referrals. That’s your signal: stop spending on what doesn’t stick.
Where Your Subscribers Actually Come From
Not all sources are created equal. Here’s what the data shows:
- Paid ads (Facebook, Google, TikTok) - Fast growth, high churn. Data from Telechurn.com shows 45-60% of paid subscribers leave within 14 days. Their CPM (cost per thousand retained users) can hit $18.75 - nearly 16x higher than organic.
- Referral programs - Slow but steady. Subscribers from friend invites have 75%+ retention at 30 days. They’re loyal because someone they trust vouched for you.
- Organic search and content - People who find you via Google or YouTube are highly engaged. They came looking for something specific. Their conversion rate is 2.7x higher than paid traffic.
- Collaborations and shoutouts - Depends on the partner. A shoutout from a channel with 50K active users beats one with 100K ghost accounts. Always check their retention curve first.
Here’s the kicker: channels ignoring this data waste 65% of their ad budget, according to Telegram specialist Maria Kuznetsova. She audited 87 channels and found that some were spending $12 per new subscriber - but only keeping 1 in 5. Meanwhile, others using cohort analysis cut their cost per retained subscriber from $2.10 to $0.85 in three weeks.
Tools You Can Actually Use
Not all analytics tools are built the same. Here’s how the top three stack up:
| Tool | Price/Month | Source Tracking Accuracy | Retention Visualization | Conversion Tracking | Speed |
|---|---|---|---|---|---|
| Telegram Native | $0 | None | Basic growth only | No | N/A |
| MVP Project | $149 | 92% | Advanced curves | Yes (e-commerce) | 0.8s load time | TGstat | $89 | 85% | Good | Basic | 2.3s load time |
| Telemetr | $120 | 88% | Best color grid | Yes | 1.5s load time |
MVP Project leads in integration. It connects directly with Shopify, Google Ads, and Facebook Pixel. That means if someone clicks your ad, joins your channel, and buys your course - you see it all in one place. TGstat is cheaper but slower. Telemetr has the prettiest charts, but misses deeper insights.
And don’t fall for free tools. Bosslike’s free tier inflates retention by 73% - it counts inactive users as “active.” One user on Reddit said it made their channel look like a success when it was actually dying.
How to Set It Up (Step by Step)
You can’t analyze what you haven’t tracked. Start here:
- Tag every link - Use UTM parameters on every external link you share. Example:
?utm_source=facebook&utm_medium=paid_ad&utm_campaign=jan2026. Without this, you won’t know where people came from. - Create unique invite links - For every source, make a custom invite link. Telegram lets you generate these. Use them in ads, shoutouts, and YouTube descriptions.
- Choose your tool - MVP Project is best for serious monetizers. TGstat works if you’re on a budget. Telemetr if visuals matter most.
- Wait 14 days - Let enough data build up. You need at least 200-300 new subscribers per source to see patterns.
- Compare retention curves - Look at Day 7, Day 30, Day 90. Which source keeps people? Which one burns cash?
- Shift your budget - Cut 50% from the worst-performing source. Double down on the best. Repeat every 30 days.
Pro tip: Use a Telegram bot to auto-tag new subscribers. Bosslike’s guide shows this cuts tagging errors by 88%. Manual tagging? 63% of users mess it up.

What’s Next: AI and the Future
Telegram’s beta version 9.6.2 (released January 30, 2024) now shows 7- and 30-day retention - but still no source breakdown. They’re catching up, but slowly.
MVP Project just launched their Cohort Intelligence Engine at Telegram DevCon on February 1, 2024. It uses AI to predict which new subscribers will churn - before they even stop opening messages. In tests, it’s 89% accurate. That means you can pause a bad ad campaign before it wastes $1,000.
And with Telegram’s new Shopify partnership, you can now track purchases directly from your channel. If someone buys your product after clicking your invite link - you know exactly which cohort made the sale.
Biggest Risks and Pitfalls
There are three traps you must avoid:
- Phantom growth - Gaining 500 subscribers but losing 73% in two weeks. This happens with cheap paid ads. Your numbers look great. Your wallet doesn’t.
- Data delay - Telegram’s API takes 24-72 hours to update. If you make a decision based on yesterday’s data, you’re already behind.
- Privacy settings - 38% of users disable “Last Seen.” That means tools can’t track their activity. You’ll see “inactive” users who are actually active - just private.
Also, Telegram’s updated API terms (March 1, 2024) include a clause allowing them to restrict third-party analytics. That’s why some analytics companies saw stock drops in early February. Don’t rely on one tool. Always have a backup plan.
Who Should Do This - And Who Shouldn’t
Do this if:
- You earn over $1,000/month from your channel
- You run paid ads
- You sell products, courses, or services
- You’re tired of guessing where your money goes
You don’t need this if:
- You’re a hobbyist with under 5,000 subscribers
- You don’t monetize at all
- You’re okay with spending money without knowing why
Popsters found that 89% of channels earning over $1,000/month use cohort analysis. Only 22% of those under $100/month do. The gap isn’t luck. It’s data.
What’s the cheapest way to start cohort analysis?
Start with UTM parameters and free Google Sheets. Manually tag every link you share. Use Telegram’s native stats to track daily growth. After 30 days, compare sources manually. It’s slow, but it works. Upgrade to a tool like TGstat ($89/month) only after you see clear patterns.
Can I track subscribers who don’t have phone numbers linked?
No. Telegram blocks access to phone numbers for privacy. That’s why tools rely on unique invite links and UTM parameters instead. As long as someone joins via your tagged link, you can track their behavior - even if they never connect a phone.
How long does it take to see results?
At least 14 days. You need enough new subscribers from each source to see clear retention patterns. Most users start seeing differences between sources after 30 days. Don’t rush it - bad decisions based on early data cost more than waiting.
Do I need coding skills to use these tools?
No. Tools like MVP Project and TGstat have drag-and-drop dashboards. You need to understand UTM parameters and how to read retention curves - but not code. PR-Cy.io’s free certification course covers exactly what you need in under 10 hours.
Is cohort analysis worth it for small channels?
Only if you plan to monetize. If you’re just sharing memes, skip it. But if you want to sell something, even a $5 digital product, knowing which source brings buyers is critical. A small channel with 2,000 highly engaged subscribers can out-earn a big one with 20,000 ghost accounts.
Latest Posts