You've spent weeks growing your Telegram news channel. The subscriber count is climbing, and the initial buzz is great. But then you notice a frustrating trend: people join in droves during a breaking news cycle and vanish just as quickly. You're leaking users, and typical "vanity metrics" like total subscriber count aren't telling you why. The real problem isn't just getting people to hit that join button; it's keeping them long enough to build a loyal habit. To fix this, you need to stop looking at your audience as one giant mass and start using cohort analysis is a behavioral analytics method that breaks users into groups based on shared characteristics or the time they joined. . By tracking these specific groups, you can figure out exactly when and why your readers are leaving and what actually makes them stay.
The Problem with Average Retention
Most channel owners look at their overall retention rate. If you have 10,000 subscribers and 1,000 leave a month, you might think you have a 10% churn rate. But that number is a lie. It blends the veteran readers who have been with you for years with the newcomers who joined yesterday. This "averaging" hides the truth. Maybe your veterans never leave, but 50% of every new group vanishes within 48 hours. If you only look at the average, you'll miss the critical failure in your onboarding process.
Cohort analysis solves this by creating slices of time. Instead of one big pool, you have a Acquisition Cohort, which is a group of people who joined your Telegram channel during a specific window, like the first week of January. By tracking only that January group over February, March, and April, you can see the actual "decay curve" of your audience. If the January group drops off sharply after day three, but the February group (where you added a new welcome guide) stays for ten days, you have concrete proof that your change worked.
Mapping the News Reader's Journey
In a news context, users usually fall into two behavioral buckets. First, there are the "Event-Driven" users. They find your channel via a viral link or a trending topic. They are high-intensity but low-loyalty. Second, there are the "Habitual" users. They want a curated daily digest and rely on you for their morning routine. To improve retention, you need to move as many people as possible from the first bucket to the second.
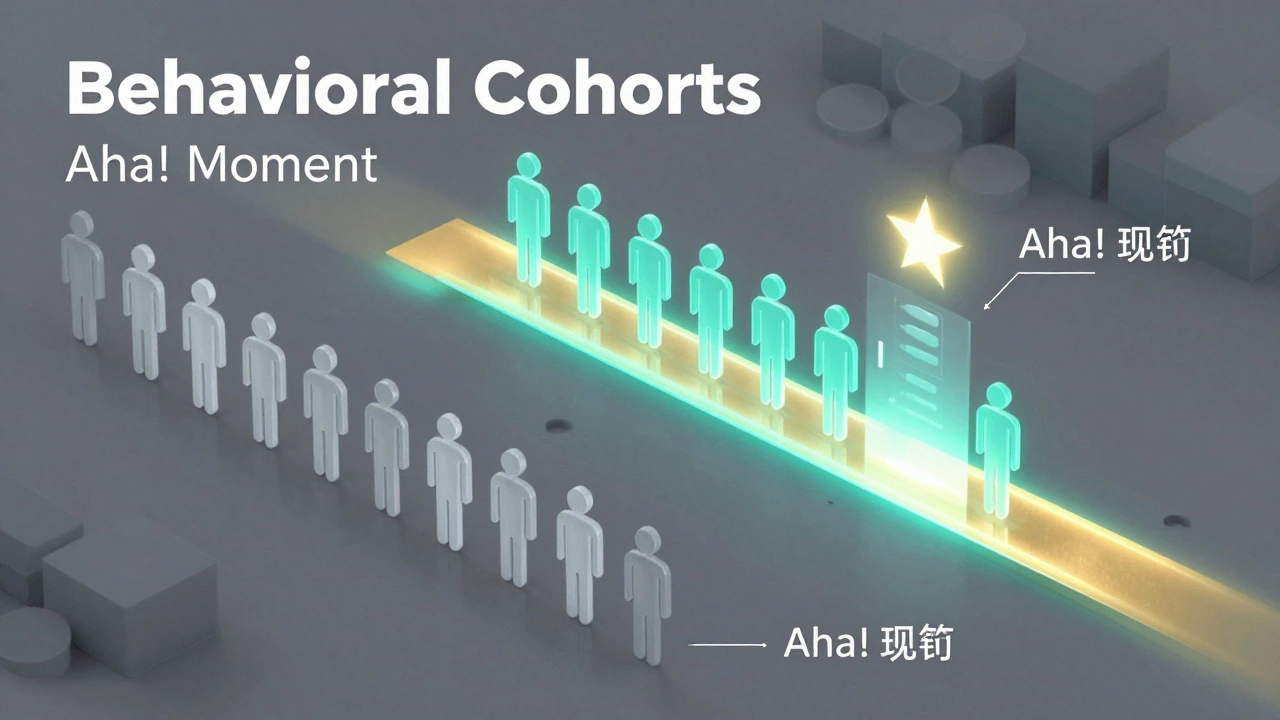
This is where Behavioral Cohorts come in. Unlike acquisition cohorts, these group people by what they do. For example, you could create a cohort of users who "clicked on at least three links in the first 24 hours" versus those who "didn't click anything." If the high-engagement cohort has a 5x higher retention rate, your goal is no longer just "getting subscribers"-it's "getting users to click three links in their first day." This is the "Aha! Moment" that triggers long-term retention.
| Cohort Type | Grouping Factor | Key Metric to Track | Goal |
|---|---|---|---|
| Acquisition | Join Date (e.g., Week 1 of March) | Retention % over time | Identify churn spikes |
| Behavioral | Action (e.g., Used Search feature) | LTV (Lifetime Value) | Find high-value behaviors |
| Channel-Based | Source (e.g., Twitter vs. Direct) | Churn Rate per source | Optimize acquisition spend |
Reading the Retention Table
When you plot your data, you'll likely use a cohort table. This is a grid where the rows are the start dates and the columns are the time elapsed. To get the most value out of this, you need to look at it in three different ways:
- Horizontal Reading: Follow a single row from left to right. This shows you the lifecycle of one specific group. If you see a steep drop in every single row at the "Month 1" mark, you have a systemic problem with your long-term value proposition.
- Vertical Reading: Look down a single column. This compares different groups at the same stage of their journey. If your April cohort has a much higher retention rate in their first week than your March cohort did, whatever you changed in April is working.
- Diagonal Reading: This tracks retention across different cohorts during a specific calendar month. If you see a dip across all cohorts in June, it wasn't a problem with the users-it was likely an external event or a dip in your content quality that month.
Turning Data into Retention Strategies
Data is useless unless it changes how you run the channel. Once you've identified your high-performing cohorts, you can use a few proven strategies to pull other users toward that same behavior.
Consider the "Reminder Effect." In a famous study of the Calm meditation app, the team found that users who set daily reminders were 3x more likely to stay than those who didn't. For a Telegram news channel, this translates to "Notification Management." You might find that users who mute the channel immediately churn. To fight this, you can encourage users to pin your channel to the top of their chat list or use a specific set of tags (like #MorningBrief) that they can search for, creating a mental hook.
Another move is to optimize your Onboarding Process. If your data shows that users who engage with a "Welcome Poll" in their first hour stay longer, make that poll the first thing they see. Don't just blast news; guide them through the value of your curation. Use the first 48 hours to prove that your channel provides a unique perspective they can't get from a generic news aggregator.
Avoiding the Common Pitfalls
It's easy to get lost in the numbers, but a few mistakes can lead you to the wrong conclusions. First, avoid "over-segmenting." If you create a cohort for every single day of the year, your sample sizes will be too small to be statistically significant. Group by week or month to get a clearer signal.
Second, don't ignore the source of your traffic. Not all subscribers are created equal. You might find that people coming from a highly targeted niche forum have an incredibly high LTV (Lifetime Value) compared to those coming from a viral TikTok clip. If you spend all your effort trying to retain the "viral" cohort, you're fighting a losing battle. Instead, shift your acquisition strategy toward the channels that bring in the high-retention cohorts.
Advanced Tools for Deep Diving
While basic spreadsheets can handle simple cohort tables, modern Behavioral Analytics tools allow you to go deeper. Tools that offer session replays or journey mapping can show you the exact path a user takes before they hit the "Leave Channel" button. For Telegram, this often means analyzing the gap between a post being published and the user's last interaction.
If you notice a specific pattern-say, users leave after the third "breaking news" alert in a single day-you've found your churn trigger. You can then A/B test your posting frequency. Try grouping three small updates into one larger "digest" post and see if that specific cohort's retention curve flattens. The goal is to find the balance between being an essential news source and becoming a nuisance in their notifications.
What is the difference between a retention rate and a churn rate?
Retention rate is the percentage of users who stay with your channel over a given period. Churn rate is the inverse-the percentage of users who leave. If your monthly retention rate is 80%, your churn rate is 20%. Cohort analysis tracks both to see exactly where the leak is happening.
How often should I perform a cohort analysis for my news channel?
For fast-moving news content, a monthly review is usually sufficient. However, if you are testing a new onboarding sequence or a change in posting frequency, you should track weekly cohorts to see the impact of those changes in real-time.
Can I do cohort analysis without expensive software?
Yes. You can export your subscriber growth and loss data into a spreadsheet and manually create a grid where the rows are the join-month and the columns are the subsequent months. The key is consistency in how you track the dates.
What is a "good" retention rate for a Telegram news channel?
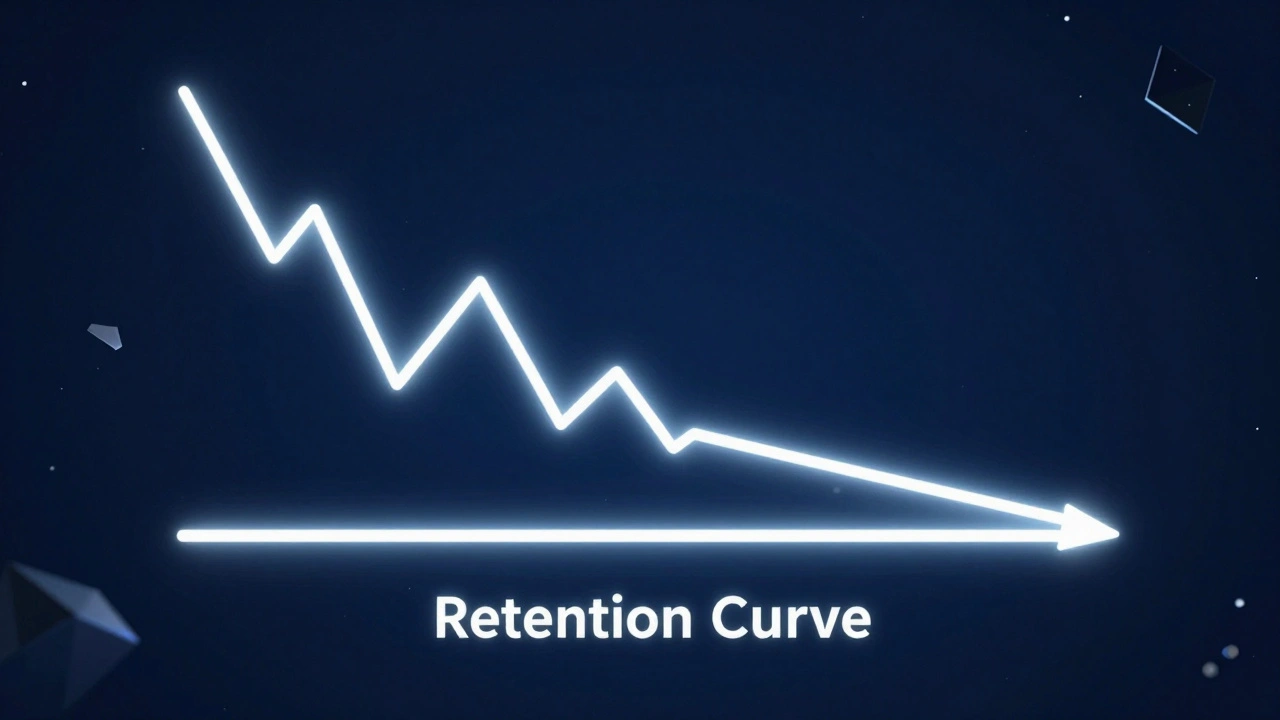
There is no universal number because it depends on your niche. However, a healthy trend is a "flattening curve." If your retention drops significantly but then stays steady (e.g., 30% of users stay indefinitely), you have found your core audience. If the curve keeps dropping toward zero, your content isn't providing long-term value.
How do behavioral cohorts differ from acquisition cohorts?
Acquisition cohorts group people by when they joined (e.g., "The January Cohort"). Behavioral cohorts group people by what they did (e.g., "Users who clicked the 'Daily Digest' link"). The former helps you identify time-based trends; the latter helps you identify which features drive loyalty.
Next Steps for Your Channel
If you're just starting, don't try to track everything. Pick one cohort analysis metric-like 30-day retention for new joins-and track it for three months. Once you see the curve, look for the "cliff." That cliff is where your users are losing interest. Whether it's a lack of variety in your news sources or too many notifications, that's where your focus should be. Turn your data into a roadmap, and your subscribers will turn into a community.