Posting into the void is a marketer’s worst nightmare. You craft the perfect message, hit send, and then… silence? Or worse, a flood of numbers that mean nothing without context. Measuring Telegram content performance is the practice of tracking specific metrics like views, clicks, and user retention to evaluate how well your channel resonates with its audience. It is not just about vanity metrics; it is about understanding human behavior in a private messaging environment.
In 2026, Telegram has evolved from a simple chat app into a robust broadcasting platform for businesses, creators, and communities. But unlike Instagram or YouTube, Telegram does not hand you a dashboard filled with colorful graphs out of the box. You have to dig deeper. This guide breaks down exactly what to measure, why it matters, and how to interpret the data to grow your channel sustainably.
The Foundation: Understanding Telegram Views
Views are the starting point. If no one sees your post, nothing else matters. However, on Telegram, "views" work differently than on public social networks. Because Telegram channels are often subscribed-to rather than algorithmically discovered, a view is a direct signal of intent.
According to industry analysis from NerdBot in 2025, views serve three distinct purposes:
- Reach Indicator: How many unique users opened the post.
- Curiosity Cue: Did your headline or preview image spark enough interest to get them to open the message?
- Algorithmic Vote: Telegram’s internal relevance model notices posts with quick, repeated openings and may surface them in search results or recent sections.
The most critical metric here is the Views-per-member ratio is a percentage calculated by dividing total post views by the total number of subscribers to gauge active engagement levels.. Here is how forward-thinking channel owners benchmark this in 2026:
- Below 10%: Dormancy. Your audience is ignoring you. Re-evaluate your content strategy immediately.
- 20-30%: Robust performance. This is the healthy standard for most successful channels.
- Above 40%: Cult-like magnetism. Your community is highly engaged and likely interacts with every post.
Click-Through Rates (CTR): The Intent Metric
Views tell you people looked. Clicks tell you they wanted more. Click-Through Rate (CTR) measures the percentage of viewers who clicked a link within your post. This is vital if your goal is to drive traffic to a website, sell a product, or move users to another platform.
The formula is simple: (Clicks ÷ Impressions) × 100. On Telegram, an impression usually equals a view. A Strong Telegram CTR is typically defined as 1-2% for promotional content, indicating effective targeting and compelling calls-to-action.. While this seems low compared to email marketing, remember that Telegram is a distraction-heavy environment. Users are chatting, reading news, and browsing groups simultaneously.
If you have high impressions but low clicks, your creative execution or targeting is off. Perhaps the link is buried too deep in the text, or the call-to-action (CTA) is weak. Conversely, a strong CTR paired with poor retention on the destination page suggests your title promised something the content didn’t deliver. Always align your headline with the landing page experience.
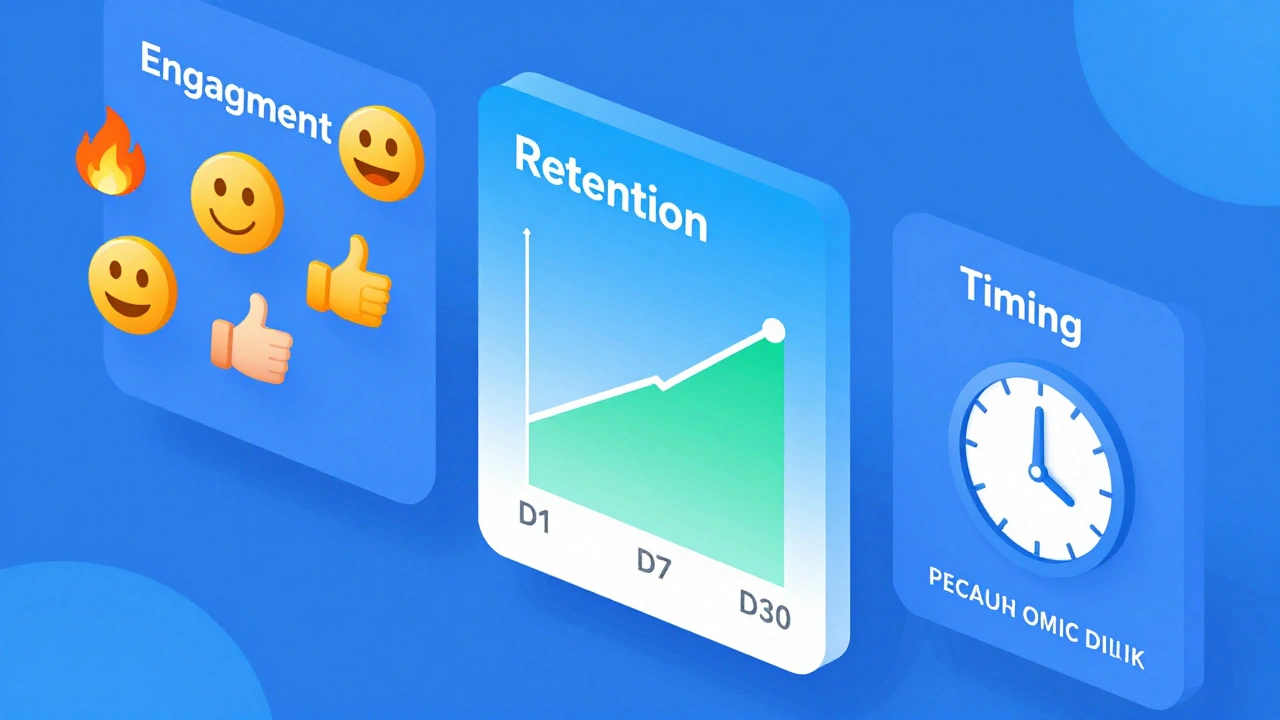
Engagement Beyond Clicks: Reactions and Forwards
Not all interactions involve leaving the app. Telegram’s native features allow for rich engagement without breaking the user’s flow. Telegram Engagement Metrics include reactions, forwards, comments, and poll responses that indicate emotional connection and value perception.
To calculate your overall engagement rate, use this formula: (Interactions ÷ Views) × 100. Interactions include likes, emoji reactions, shares, and poll votes. Here is why each matters:
- Reactions: These are quick emotional responses. A fire emoji means excitement; a sad face might indicate empathy or disappointment. Track which emojis dominate your posts to understand sentiment.
- Forwards: This is the highest form of validation. When someone forwards your post, they are vouching for its value. High forward rates indicate shareable content that expands your organic reach.
- Comments: Comments require effort. They build community and provide direct feedback. Monitor comment threads for recurring questions or pain points.
Tools like CRMChat help automate this tracking by syncing contact data and providing daily summaries of these interaction types. Without such tools, manually counting forwards is nearly impossible for large channels.
Retention: Keeping Your Audience Alive
Gaining subscribers is easy; keeping them is hard. Retention metrics reveal whether your content sustains interest over time. Mike Tkal, founder of FindMini.app, emphasizes checking D1, D7, and D30 Retention Rates are metrics measuring the percentage of new subscribers who remain active after 1, 7, and 30 days respectively..
- D1 (One-Day Retention): Did they stay after joining? Low D1 retention often indicates misleading join incentives or irrelevant initial content.
- D7 (Seven-Day Retention): Are they returning weekly? This shows habit formation.
- D30 (Thirty-Day Retention): Is your channel part of their long-term routine? High D30 retention correlates with lifetime value and brand loyalty.
For video content shared on Telegram, apply standards similar to YouTube Analytics. An Average Percentage Viewed (APV) of at least 50% for videos longer than 10 minutes indicates strong retention. If users drop off early, your hook was weak, or the video quality was poor.
Timing and Optimization Strategies
When you post matters as much as what you post. Telegram Timing Optimization involves analyzing hourly activity patterns to schedule posts during peak audience availability for maximum visibility.. Use your analytics tool to identify when your audience is most active. For many professional channels, this is between 8 AM and 10 AM local time, or during lunch breaks.
Response pattern tracking helps determine if your audience engages immediately or hours later. Some audiences prefer digesting content in the evening. Test different posting times and track the resulting views and engagement rates. Consistency is key-posting irregularly confuses the algorithm and your subscribers.
Tool Comparison for Telegram Analytics
You cannot manage complex metrics with native Telegram stats alone. Third-party tools are essential. Here is how the leading platforms compare in 2026:
| Tool | Key Feature | Best For | Limitation |
|---|---|---|---|
| CRMChat | Contact sync, voice update analysis | Sales teams and customer support | Steeper learning curve |
| TGStat | Deep historical data, competitor benchmarking | Market researchers and agencies | Paid access for detailed insights |
| Telemetr | Real-time monitoring, growth tracking | Community managers | Limited conversion tracking |
| Enreach | AI-powered insights, trend automation | Content strategists | Newer platform, less historical data |
Choose a tool based on your primary goal. If you need to track leads, CRMChat is superior. If you want to spy on competitors, TGStat is the industry standard. For automated reporting, Enreach offers modern AI-driven suggestions.
Common Pitfalls in Measurement
Avoid these mistakes to ensure your data is accurate:
- Ignoring Context: High views with low engagement mean you reached people but failed to resonate. Don’t celebrate reach without depth.
- Short-Term Thinking: One viral post doesn’t define success. Look at trends over weeks and months.
- Neglecting Segmentation: Not all subscribers are equal. Segment your audience by engagement level to focus efforts on high-value contacts.
- Overlooking External Traffic: Use UTM parameters and link shorteners like Bitly to track where Telegram users go after clicking. Connect this data to your website analytics for a full picture.
Next Steps for Implementation
Start by setting clear goals. Do you want leads, engagement, or community growth? Then, select one or two key metrics to focus on initially. Don’t try to optimize everything at once. Track your baseline views-per-member ratio, improve your CTAs to boost CTR, and monitor retention weekly. As you gather data, refine your content strategy based on what actually works, not what you assume works.
What is a good views-per-member ratio on Telegram?
A robust views-per-member ratio is between 20% and 30%. Below 10% indicates dormancy, while above 40% suggests exceptionally high engagement.
How do I calculate Click-Through Rate (CTR) on Telegram?
Use the formula: (Clicks ÷ Impressions) × 100. On Telegram, impressions are typically equivalent to views. A strong CTR is considered 1-2%.
Why is retention important for Telegram channels?
Retention metrics (D1, D7, D30) show if subscribers stay engaged over time. High retention indicates content relevance and builds long-term community value, whereas low retention suggests churn.
Which tools are best for Telegram analytics in 2026?
Leading tools include CRMChat for sales integration, TGStat for competitor benchmarking, Telemetr for real-time monitoring, and Enreach for AI-driven insights.
How can I improve my Telegram engagement rate?
Focus on creating shareable content that encourages forwards and reactions. Optimize posting times based on audience activity patterns and use clear calls-to-action to drive clicks.