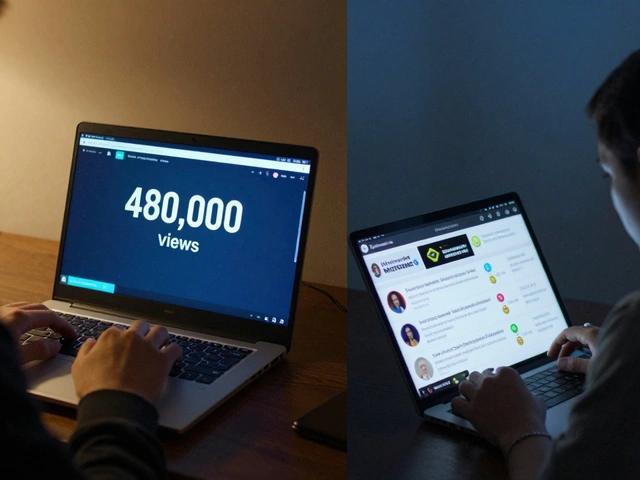
You’ve built a Telegram channel. You’ve got thousands of subscribers. But do they actually like what you’re posting? It’s a question that keeps many content creators up at night. The truth is, the number next to your channel name tells you almost nothing about how people feel. A huge subscriber count can mask a bored audience who just never hit "unsubscribe." If you want to know if your readers are happy, you have to look past vanity metrics and dig into behavior.
As of 2026, Telegram is a messaging app used by millions specifically for news consumption. Research from Popsters shows that 75% of users rely on it for news because it feels more convenient than traditional platforms. With news being the dominant content type at 82%, the competition is fierce. Standing out isn't just about getting clicks; it's about keeping those clicks coming back. Measuring satisfaction isn't a nice-to-have; it's the difference between a growing community and a ghost town.
The Retention Rate: Your Truest Signal
If there is one metric that screams "satisfaction," it is retention. Think of it this way: if someone stays, they are likely satisfied. If they leave, they aren't. Collaborator.pro’s 2026 analysis highlights that tracking unsubscribes is crucial. You need to compare the number of people leaving against your total subscriber base to calculate your retention rate.
A high retention rate means your audience finds value in your content. They wake up, check their phone, and see your update. They don’t skip it. Conversely, a spike in unsubscribes is a red flag. It signals declining satisfaction. Maybe you posted too much spam, or maybe your tone shifted. Don't wait for the numbers to drop significantly before investigating. Watch the churn rate weekly. If you lose more people than you gain in a month, something is wrong with the core experience you're providing.
Engagement Rate by Reach (ERR): The Quality Check
Subscribers might follow you, but are they interacting? This is where Engagement Rate by Reach (ERR) comes in. Unlike generic engagement rates that divide likes by total followers, ERR divides reactions by actual reach. The formula is simple: (number of reactions per post ÷ reach per post) × 100%.
Why does this matter? Because reach tells you how many people actually saw the post. If 10,000 people see your article and only 10 react, your ERR is 0.1%. That’s low. It suggests that while people saw the headline, the content didn’t resonate enough to warrant a tap. Satisfied subscribers engage. They like, comment, and share. A higher ERR percentage indicates that your content is compelling. It’s a direct proxy for satisfaction because interaction requires effort. People don’t waste effort on things they dislike.
Post Reach and VRpost: Are They Seeing You?
Reach is the denominator in your ERR calculation, but it’s also a standalone indicator of health. Post reach shows the total unique users who viewed a publication. For news channels, checking reach after 24 hours provides an early pulse on content resonance. High relative reach means your algorithmic standing is strong, which usually happens when previous posts were well-received.
Another critical metric is VRpost, or Views Per Subscriber Ratio. This measures how many of your total subscribers actually saw a specific publication. A high VRpost percentage means your audience is active and engaged. A low VRpost suggests two bad things: either your subscribers have muted your notifications because they’re tired of your content, or Telegram’s algorithm has suppressed your channel due to past low engagement. Both scenarios point to declining satisfaction. You need to audit your recent posts. Did you start clicking-baiting? Did you lower the quality? Low visibility is often a symptom of lost trust.
The Trap of Raw Subscriber Counts
It is tempting to brag about hitting 100,000 subscribers. But as Collaborator.pro points out, this number cannot be considered in isolation. Who are these people? Where are they located? What language do they speak? A channel with 100,000 geographically dispersed, linguistically diverse subscribers will naturally have lower aggregate engagement than a niche channel with 50,000 highly targeted followers.
Satisfaction measurement must account for demographics. If you are a local news channel in Asheville, North Carolina, but half your subscribers are from another continent, their engagement might be lower not because they hate your content, but because it’s irrelevant to their daily lives. Segment your data. Look at engagement by location, age, and language. You might find that you are highly satisfying one group while completely missing the mark with another. Adjusting your content strategy based on these segments can boost overall satisfaction without needing to change your entire brand voice.
Content Diversity and Frequency
People get bored. Text-only updates are efficient, but they lack dynamism. Popsters’ research recommends diversifying formats: use photos, videos, audio clips, and polls. Satisfied subscribers prefer variety. Tracking which formats generate the highest ERR helps you understand what your audience enjoys. If video posts consistently get double the reactions of text posts, lean into that. However, balance is key. Flooding your feed with low-quality videos just to chase metrics will backfire.
Frequency matters too. News channels typically publish at least two to three times a day. Deviating from this norm impacts satisfaction. Posting too little makes you feel inactive and irrelevant. Posting too much overwhelms subscribers, leading to notification fatigue and eventual unsubscription. Find your sweet spot. Consistency builds habit. Habit builds satisfaction. Track your daily posting frequency and ensure it aligns with the expectations set by your channel’s theme.
Credibility and the Channel Citation Index
In the world of news, credibility equals satisfaction. Readers want to trust the source. The Channel Citation Index (CCI), defined by Collaborator.pro, measures how often other reputable channels mention or reference your content. While CCI measures reputation rather than direct user happiness, the correlation is strong. High-quality, credible channels retain subscribers longer. If other trusted news sources cite you, your subscribers feel validated in their choice to follow you. They trust that you are accurate and original. Republishing content without adding value lowers your perceived quality and, consequently, your subscriber satisfaction.

Why Surveys Fail and Behavior Wins
You might think sending a poll asking "Are you happy?" is the best way to measure satisfaction. Pew Research’s 2020 analysis warns against this. Respondents suffer from "social desirability bias." They want to appear informed and engaged, so they exaggerate their satisfaction levels. Direct surveys are noisy and unreliable.
Rely on behavioral metrics instead. Engagement rates, retention rates, time spent on channel, and share frequency tell the truth. Actions speak louder than words. If people are sharing your links to their own channels, that is the highest form of satisfaction. They are vouching for you. Track subscription sources too. Subscribers who come via recommendations from friends or citations in respected sources tend to stay longer and engage more than those acquired through paid ads. Organic growth often correlates with higher satisfaction.
Tools for Measurement
To track these metrics effectively, you need the right tools. Platforms like Tgstat provide comprehensive channel-level statistics, including average post reach, daily views, and mention frequency. These tools allow you to monitor satisfaction indicators without harassing your audience with questions. Use them to identify trends. Is your ERR dropping over the last month? Is your unsubscribe rate spiking on weekends? Data-driven decisions beat gut feelings every time.
| Metric | What It Measures | Satisfaction Indicator |
|---|---|---|
| Retention Rate | Unsubscribes vs. Total Subscribers | High retention = High satisfaction |
| ERR | Reactions divided by Reach | High ERR = Content resonates deeply |
| VRpost | Views per Subscriber Ratio | High VRpost = Active, engaged audience |
| CCI | Citations from other channels | High CCI = Trusted, credible source |
| Source Quality | Where new subs come from | Organic/Referral > Paid Ads |
Conclusion
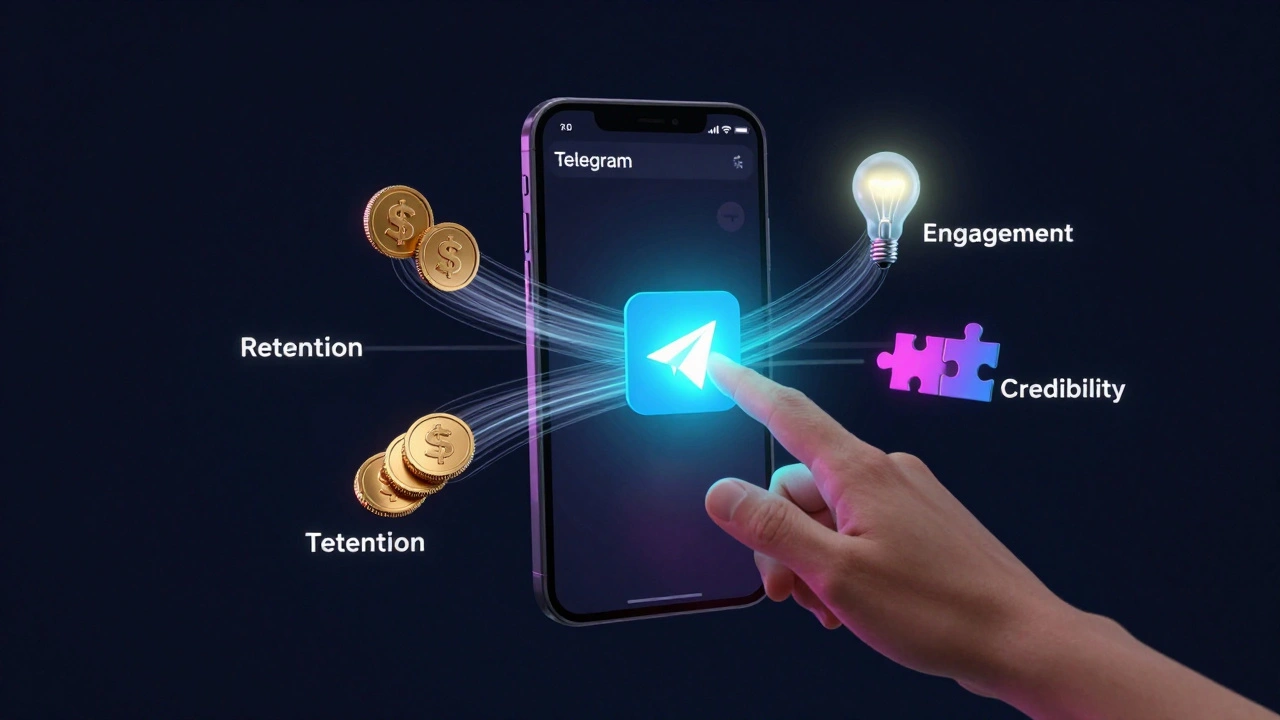
Measuring satisfaction on Telegram is not about finding a single magic number. It is about weaving together retention, engagement, reach, and credibility into a coherent picture. Satisfied subscribers stay, interact, and share. Dissatisfied ones mute, ignore, or leave. By focusing on these behavioral truths rather than vanity counts or biased surveys, you can build a news channel that truly serves its audience. Keep your content diverse, your frequency consistent, and your credibility high. The metrics will follow.
What is the most important metric for Telegram channel success?
While subscriber count gets attention, retention rate is the most critical metric for long-term success. It directly reflects whether your audience finds value in your content. Combined with Engagement Rate by Reach (ERR), it gives a complete picture of both loyalty and immediate content impact.
How do I calculate Engagement Rate by Reach (ERR)?
Calculate ERR using the formula: (number of reactions per post ÷ reach per post) × 100%. This metric is superior to standard engagement rates because it accounts for how many people actually saw the post, filtering out inactive subscribers who never view your content.
Why should I avoid direct subscriber surveys?
Direct surveys are prone to "social desirability bias," where respondents exaggerate their satisfaction to appear informed or polite. Behavioral metrics like shares, retention, and reaction rates provide objective data that reflects true user sentiment without the noise of self-reported bias.
What does a low VRpost indicate?
A low Views Per Subscriber Ratio (VRpost) indicates that a large portion of your subscriber base is not seeing your content. This could mean subscribers have muted your notifications due to dissatisfaction, or that Telegram's algorithm has suppressed your channel due to historically low engagement.
How does demographic segmentation affect satisfaction metrics?
Aggregate metrics can hide issues within specific groups. A channel might satisfy a local demographic while failing to engage international subscribers. By segmenting data by location, language, and age, you can tailor content to improve satisfaction for underserved groups, boosting overall performance.